Question 26 of 30
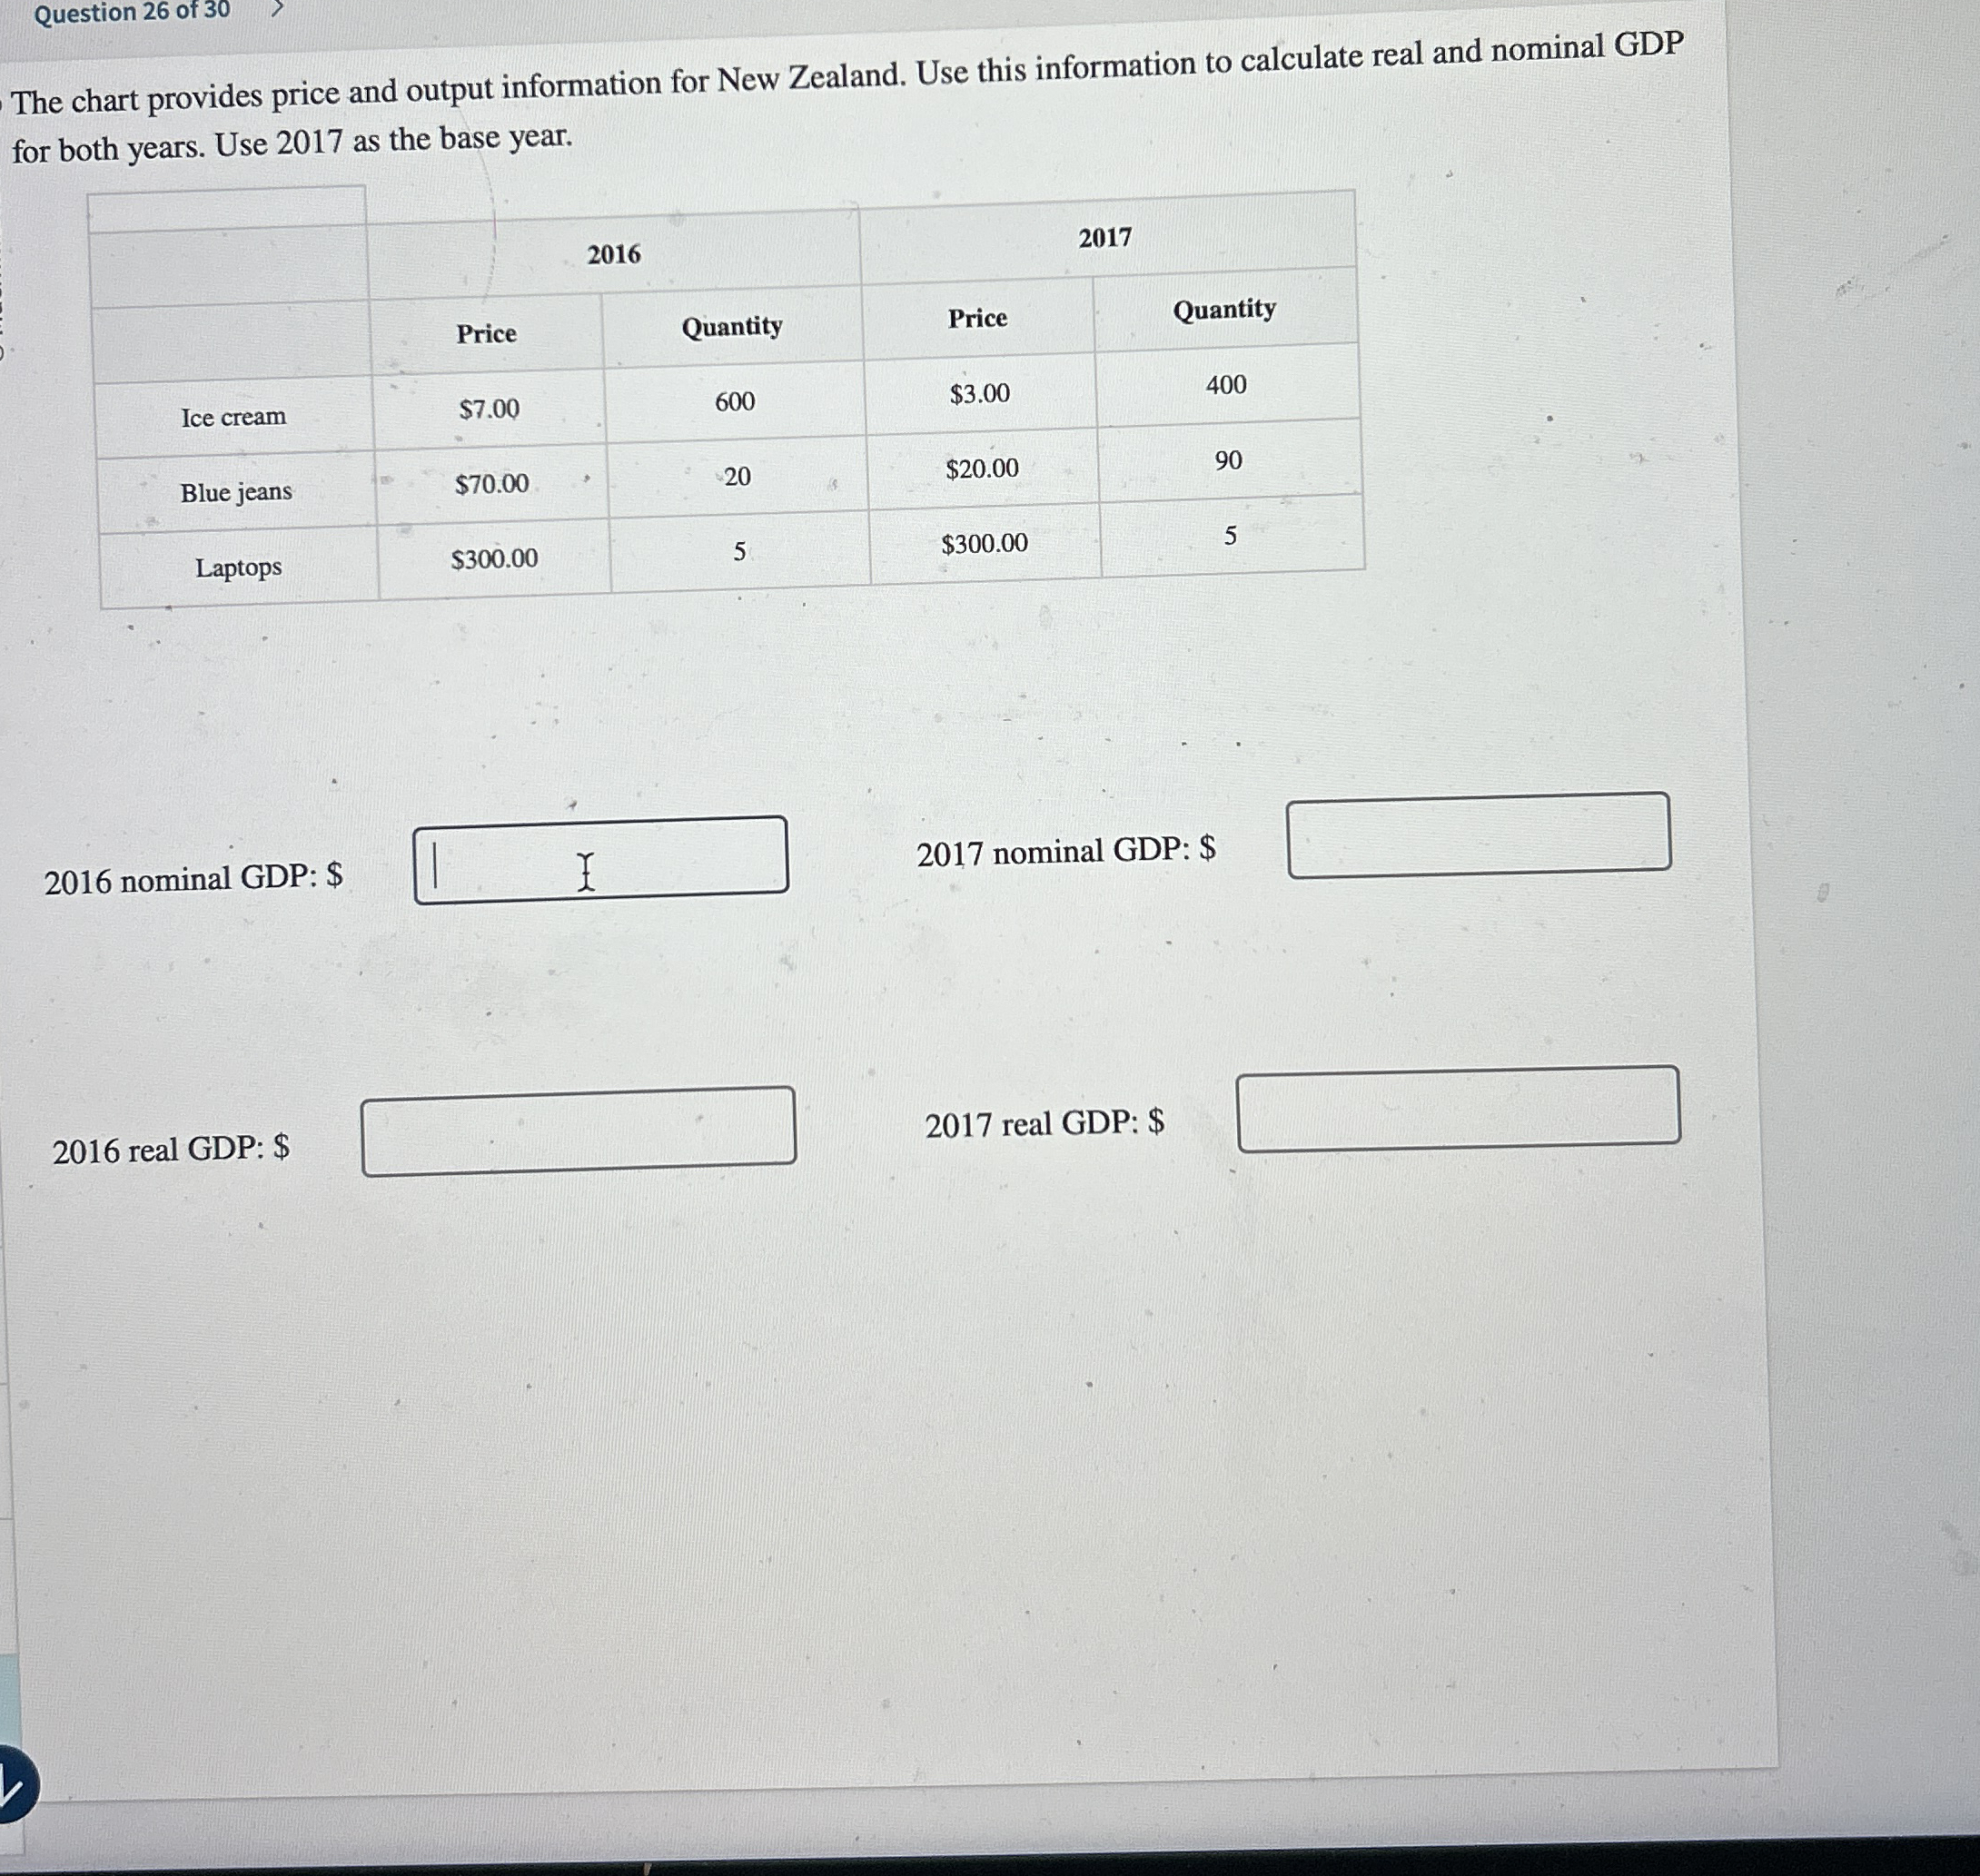
The chart provides price and output information for New Zealand. Use this information to calculate real and nominal GDP for both years. Use 2017 as the base year.
\table[[,,2016,],[,,,,],[,Price,Quantity,Price,Quantity],[Ice cream,
$7.00,600,
$3.00,400],[Blue jeans,
$70.00,20,,],[Laptops,
$300.00,5,
$20.00,90]]
2016 nominal GDP: $
2017 nominal GDP: $
2016 real GDP: $
2017 real GDP: $