Home /
Expert Answers /
Statistics and Probability /
figure-1-shows-95-confidence-intervals-computed-from-independent-random-samples-of-size-n-30-from-a-pa741
(Solved): Figure 1 shows 95% confidence intervals computed from independent random samples of size n=30 from a ...
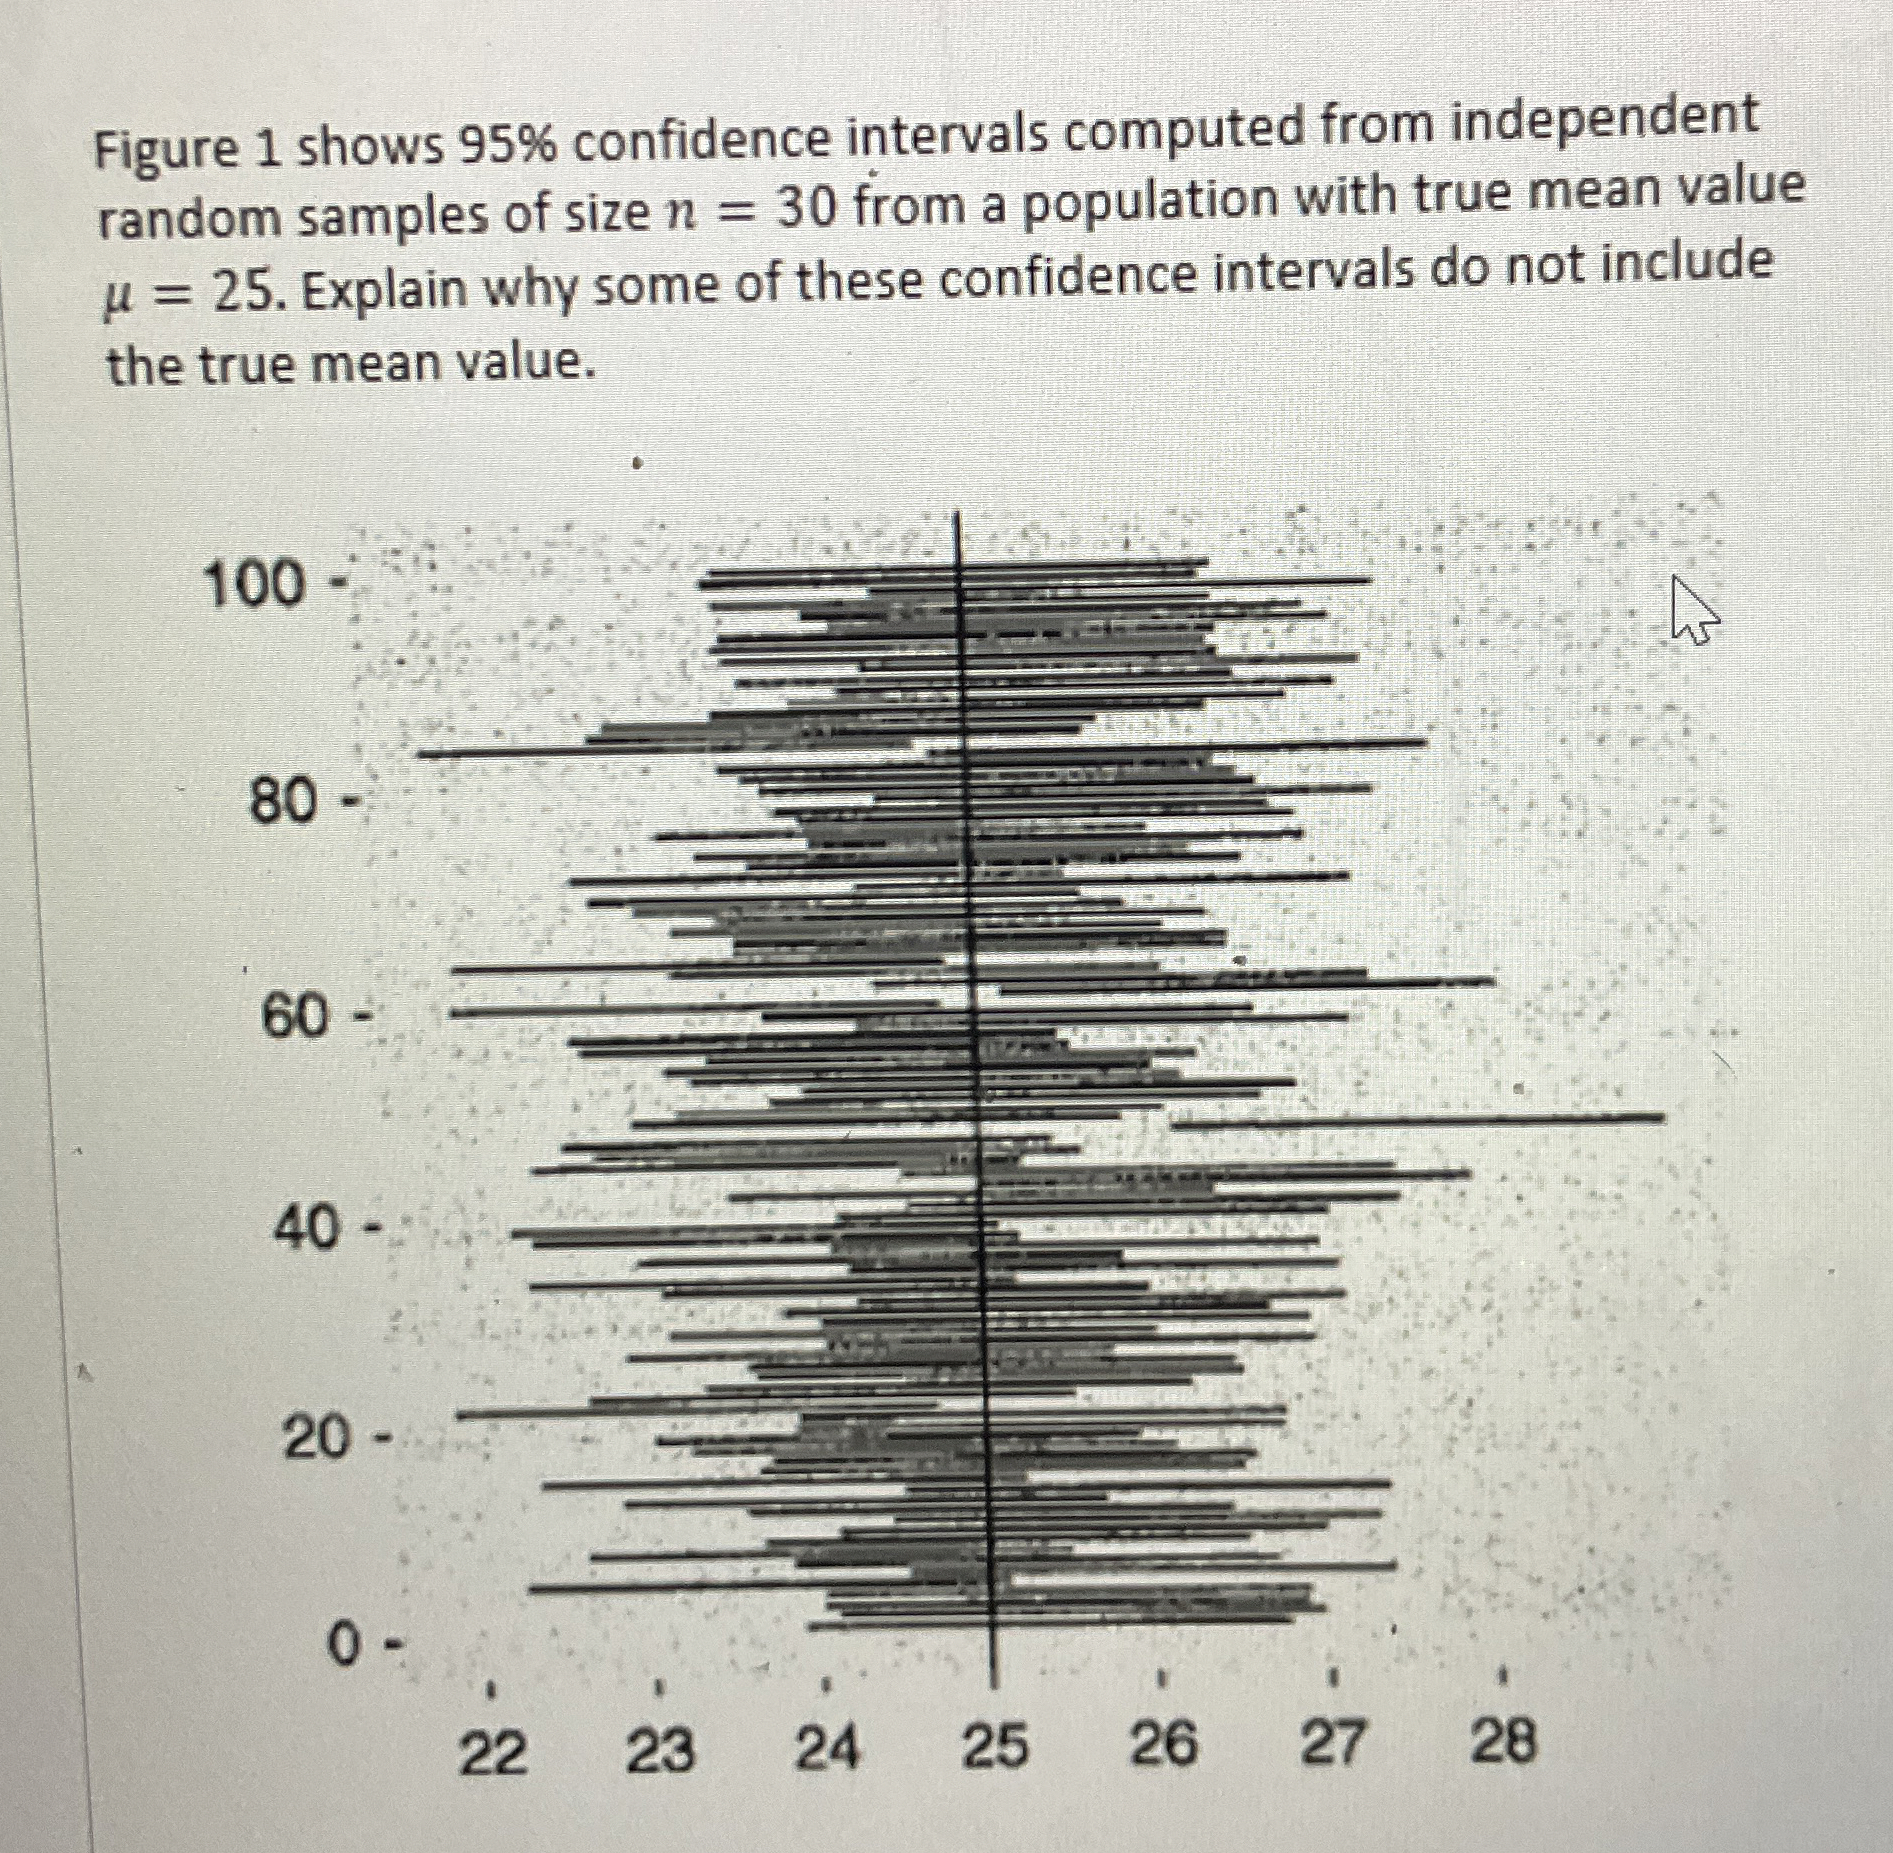
Figure 1 shows 95% confidence intervals computed from independent random samples of size
n=30from a population with true mean value
\mu =25. Explain why some of these confidence intervals do not include the true mean value.