(Solved): colds 40 classes n=32 colds 40 classes n=32 test for Nn=40 phats Given that the computer graphs f ...
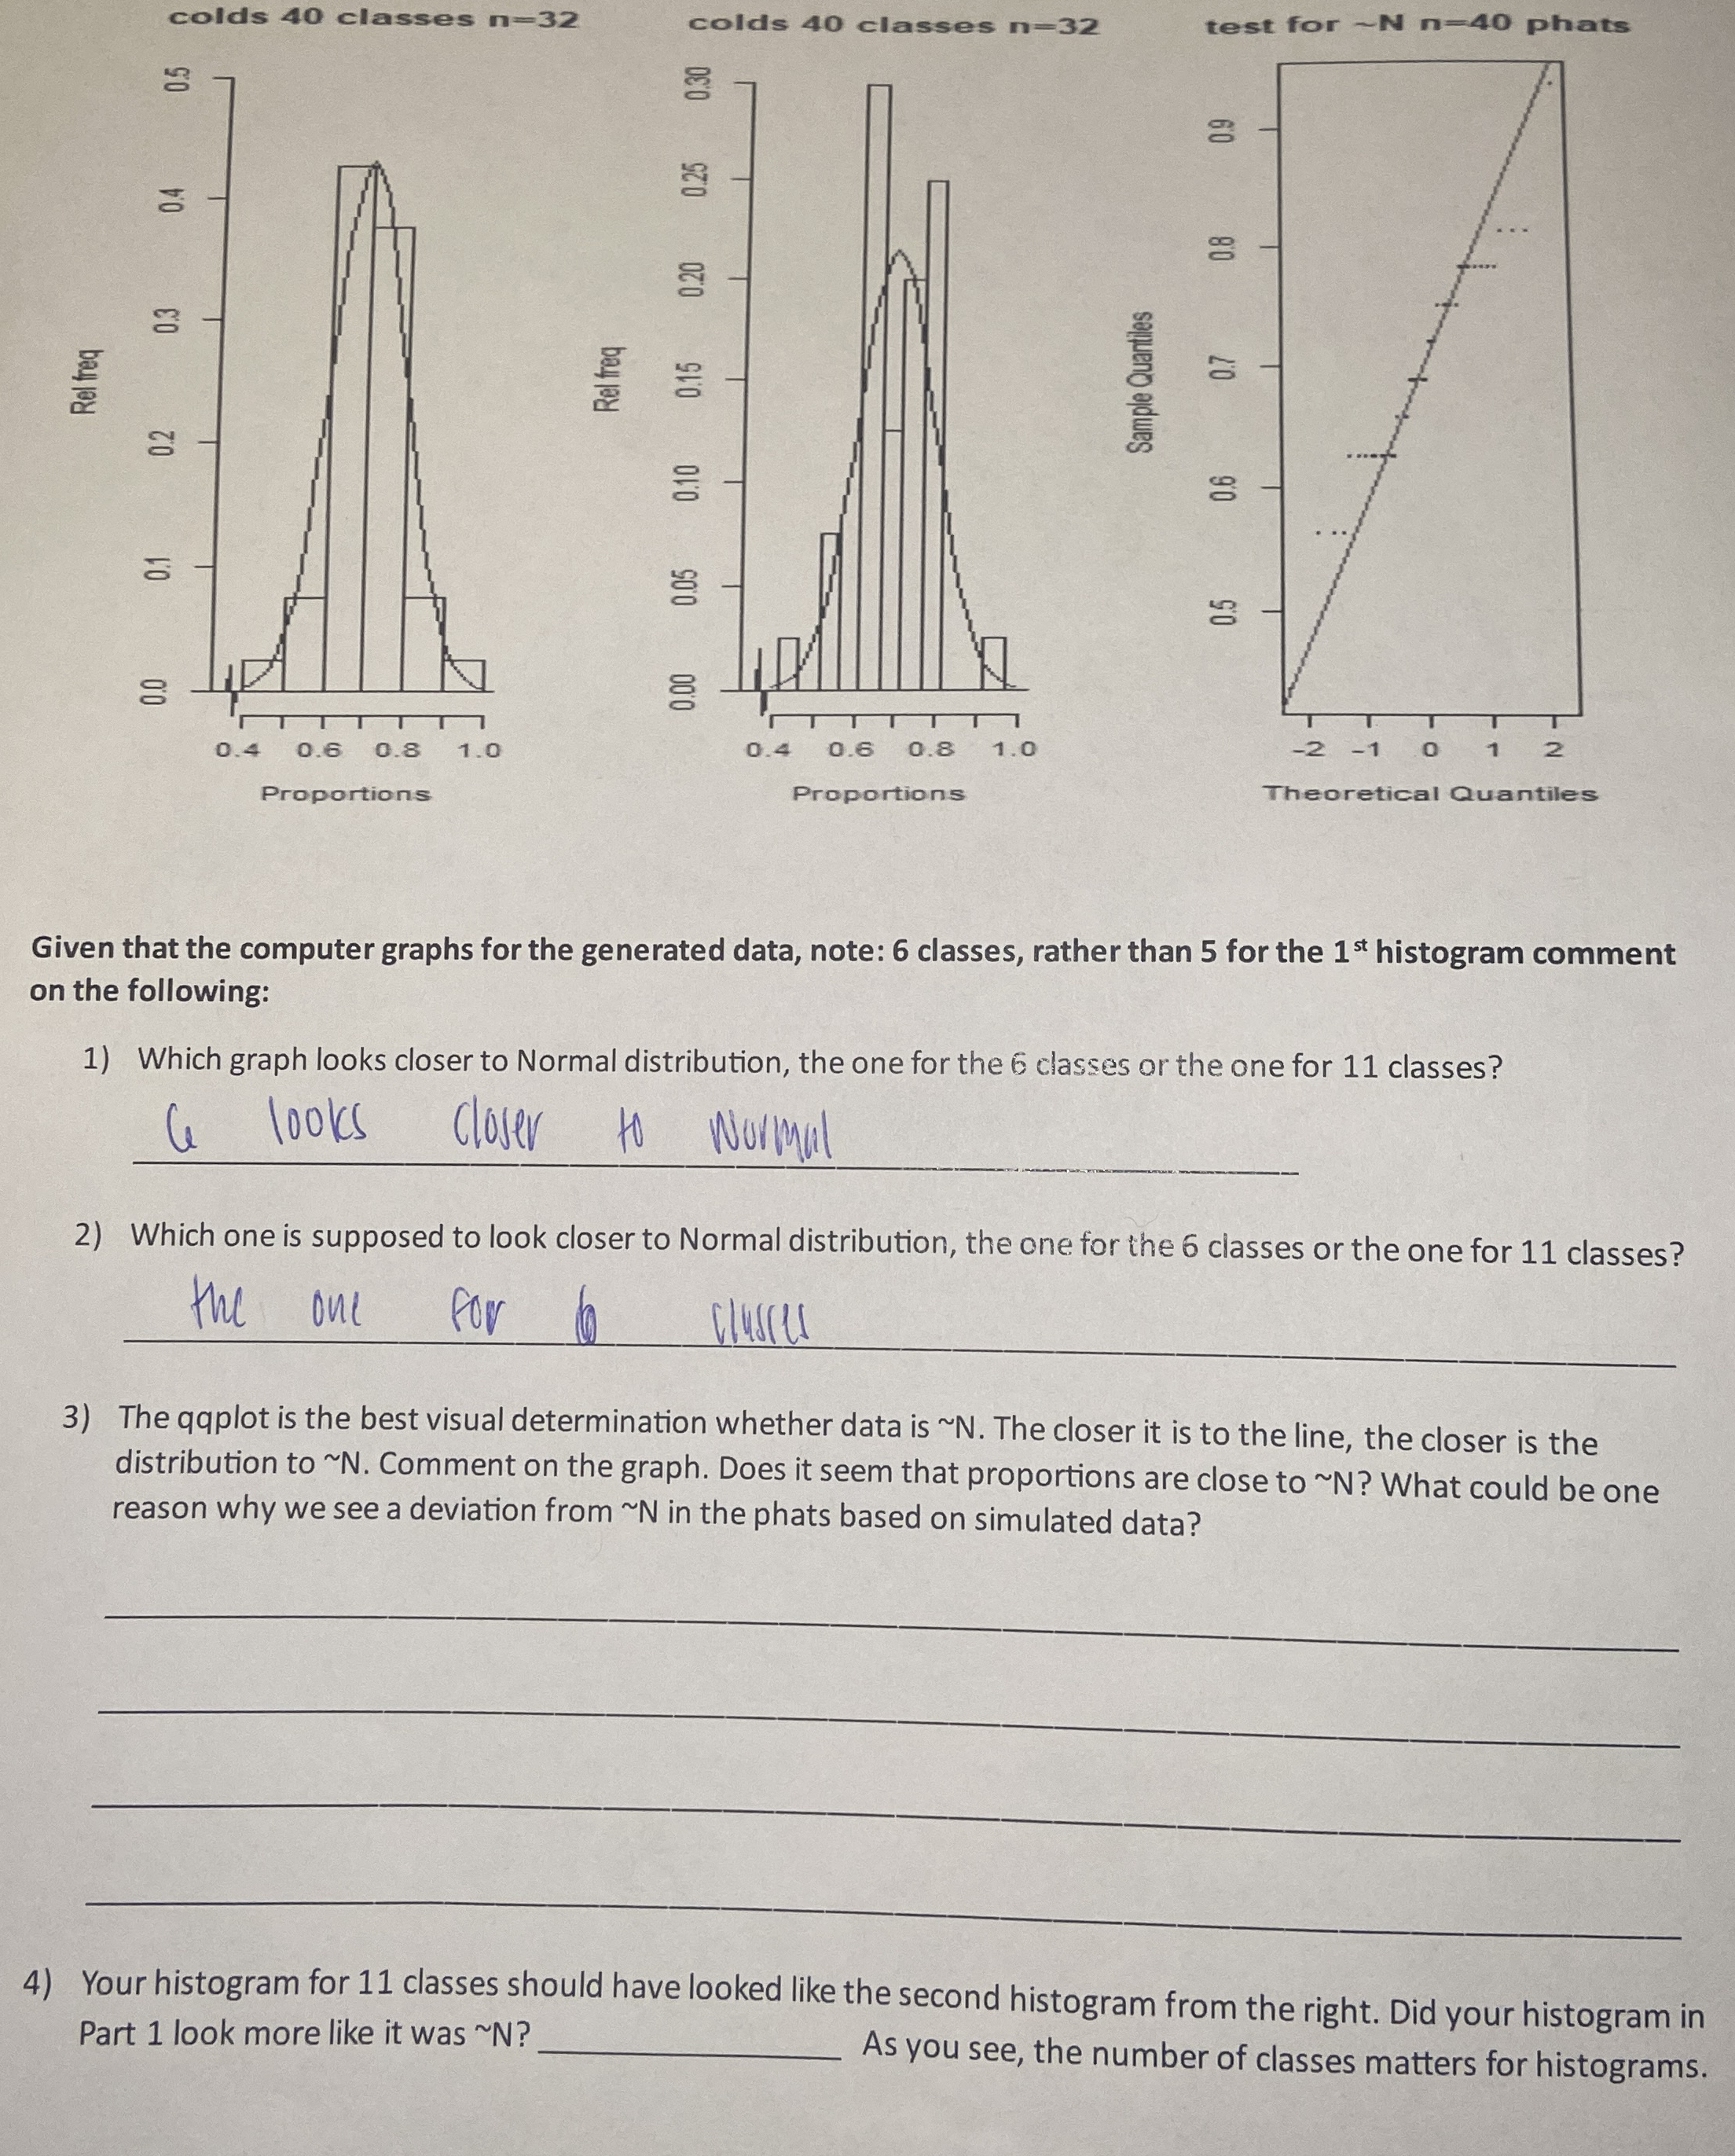
colds 40 classes
n=32colds 40 classes
n=32test for
∼Nn=40phats Given that the computer graphs for the generated data, note: 6 classes, rather than 5 for the
1^(st )histogram comment on the following: Which graph looks closer to Normal distribution, the one for the 6 classes or the one for 11 classes?
q,Which one is supposed to look closer to Normal distribution, the one for the 6 classes or the one for 11 classes?
◻The qqplot is the best visual determination whether data is
∼N. The closer it is to the line, the closer is the distribution to
∼N. Comment on the graph. Does it seem that proportions are close to
∼N? What could be one reason why we see a deviation from
∼Nin the phats based on simulated data? Your histogram for 11 classes should have looked like the second histogram from the right. Did your histogram in Part 1 look more like it was
∼N? As you see, the number of classes matters for histograms.